Beam energy stability verification
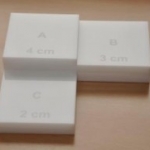
Using small build up phantom placed on the surface of the imager. Analysis of single phantom image provides dose information of 4 different depths along the depth dose curve measured in water.
Build up phantom
Each sector is covered by different material thickness resembling different detector depth.
Depth dose curve analysis window
Example of energy stability analysis (green line – water phantom measurement, red dots – Eclipse, blue squares – measurement using EPID)
Last update on 21. March 2013


